Kinematics II - Graphs as an aid for problem solving
v x t graphs
The basic concepts in kinematics are described in a previous page. I will only repeat here that:
The acceleration is the gradient of the v x t graph
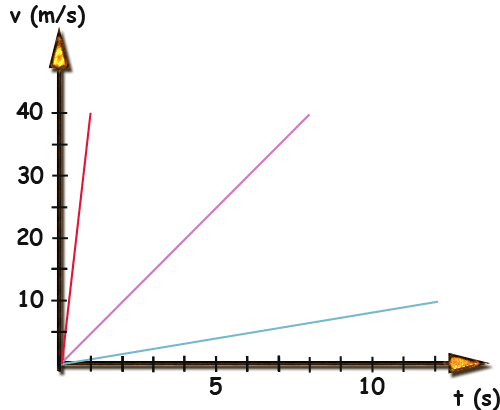
In the graphs below , lines of different colours represent different motions!
Example 1

d = v * t
Calculation acceleration:
a = v / t
gradient of the red line = 40 so that a = 40 m / s2
gradient of the purple line = 5 so that a = 5 m / s2
____________________________________________________________
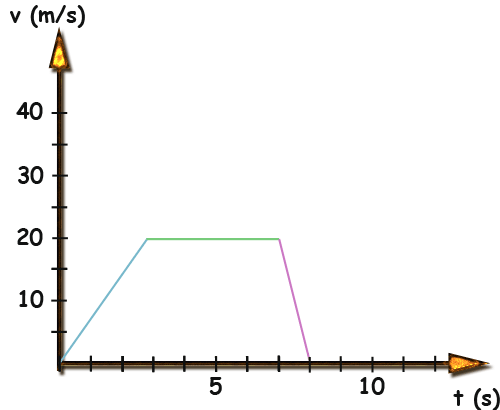
Example 2

Calculation acceleration:
Blue line : gradient = 20/3 -->a = 6.6 m / s2
green line = constant speed = 20 m/s --> a = 0
purple line --> a = - 20 m / s2
Calculation of distance travelled:
d = v*t
Example: A car travels at 50 miles / h, during 3 hours
d = 150 miles
Graphically, it is the area under the vxt graph:
For the green line --> 20 * 4 = 80 m
The total distance is the area of the trapezium (made of the blue, green and purple lines) --> 1/2 * 20 ( 8+4) = 120 m
__________
distance travelled during acceleration (area under blue line) --> 10*3= 30 m
__________
distance travelled while breaking ( area under purple line)--> 10 *1 = 10 m
Notice that the gradient of the purple line is negative, so that this negative acceleration means breaking (when the velocity is positive). That means, velocity to the right and acceleration to the left , opposing the movement.
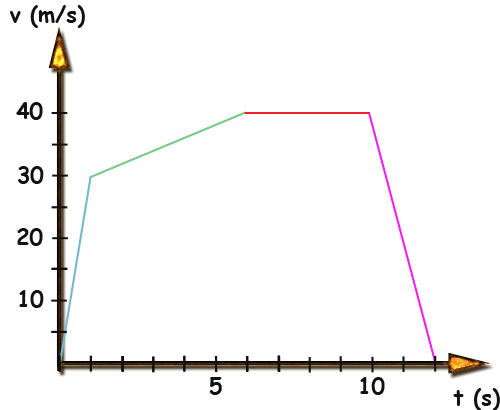
Exercise

Determine the accelerations and the total distance travelled.
Kinematics - Further Exercises >>
© Ricardo Esplugas. All images in this site can be bought in an enlarged version. Please contact me on ricardochemistry@gmail.com

